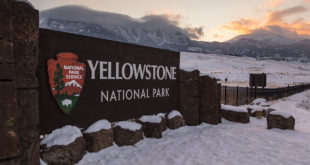
We knew it would be a busy summer when crowds descended on the Park in the middle of May, but that’s not necessarily borne out by the Yellowstone visitation numbers as reported by officials.
That’s because Yellowstone National Park officials are using a slightly different method of computing the number of visitors to the Park. Specifically, the multiplier associated with vehicles has changed: instead of assuming 2.91 passengers are in every car entering Yellowstone, the assumption now is that 2.58 persons for vehicle are entering the Park. (Last summer, the National Park Service conducted surveys to gauge the accuracy of the multipliers which have been in use for nearly 20 years. Based on the survey results, Yellowstone began using new, monthly lower person-per-vehicle multipliers as of January 2013.)
So, technically, the number of visitors has declined this year over last, despite anecdotal evidence that Yellowstone visitation is indeed up. Last year, the tally was 791,770 visitors descending upon Yellowstone, as opposed to the 744,056 tallied this year. But our rough tally has 2013 visitation in excess of 840,000 if the old formula was used. That would be roughly in line with reports from the field regarding sold-out hotels and campgrounds and longer-than-usual queues throughout Park facilities.
For the record, National Park Service officials estimate 1,016,651 visitors have visited Yellowstone National Park this year under the new formula, versus 1,041,898 under the old formula, a theoretical decline of 2.42 percent. Here’s the chart for the year:
One area where formulas don’t apply: the number of cars and RVs entering the Park:
This shows a clear jump in the number of vehicles entering Yellowstone. Most of this increase came from folks entering the Park’s North and East entrances.
Image courtesy National Park Service.
 Yellowstone Insider Your Complete Guide to America's First National Park

